Splenic Macrophage Aggregates
in Silver Porgy From the St. Lucie Estuary
Data page
Links to home page, deformities study, mac methods, utility of MMC as bioindicator.
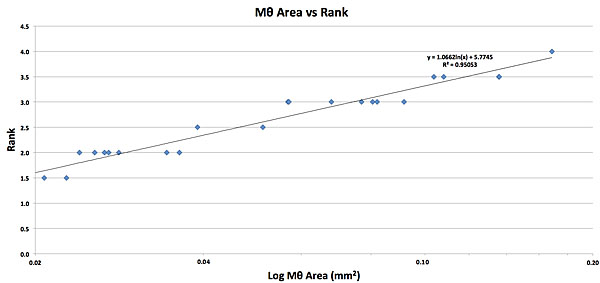
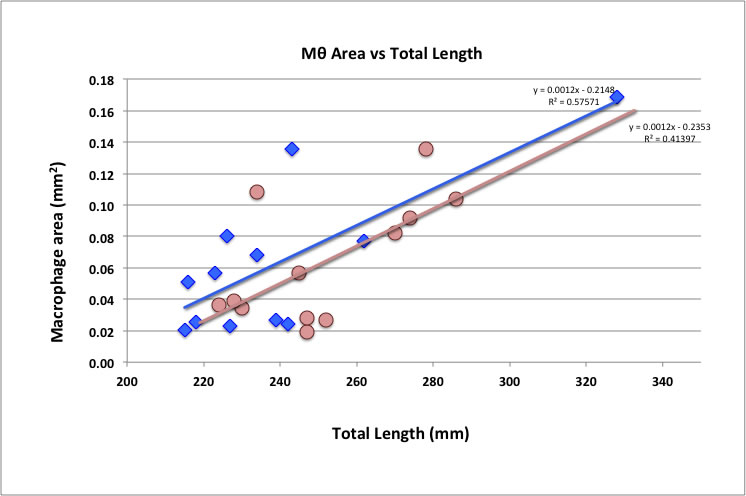
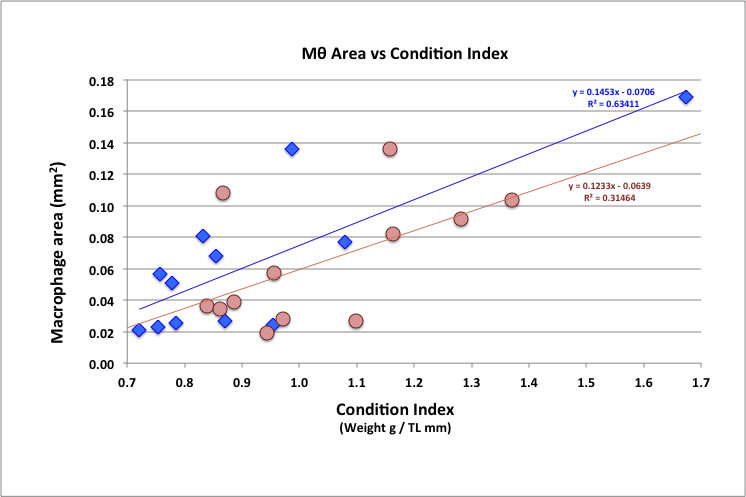
Description of overall data first, below, relating to gender, site, size and condition index), followed by relationships between mac area and gender, length of fish, condition index, ranking scheme, MMC size distribution (graphs).
APL
Case # |
Gender |
Collection Site |
Weight (g) |
TL (mm) |
Mean # Mθ |
Mean # Mθ (per sq mm) |
Mθ Area/ 0.81 mm2 |
Mθ Area (mm2) |
% small |
% med |
% large |
Condition index
(weight/TL) |
Spleen Ranks |
| APL11-10 |
Male |
10 |
549 |
328 |
66.0 |
81.5 |
0.13681 |
0.16891 |
11.7 |
15.6 |
72.7 |
1.67 |
4.0 |
| APL11-11 |
Male |
10 |
168 |
216 |
13.3 |
16.5 |
0.04145 |
0.05117 |
26.9 |
32.2 |
40.8 |
0.78 |
2.5 |
| APL11-12 |
Male |
10 |
208 |
239 |
12.3 |
15.2 |
0.02192 |
0.02706 |
3.0 |
34.7 |
62.2 |
0.87 |
2.0 |
| APL11-13 |
Female |
10 |
233 |
247 |
9.3 |
11.5 |
0.01559 |
0.01924 |
7.0 |
17.4 |
75.6 |
0.94 |
1.5 |
| APL11-14 |
Male |
10 |
171 |
218 |
14.7 |
18.1 |
0.02071 |
0.02556 |
5.5 |
24.2 |
70.4 |
0.78 |
2.0 |
| APL11-15 |
Male |
10 |
169 |
223 |
24.7 |
30.5 |
0.04596 |
0.05674 |
10.8 |
26.8 |
62.3 |
0.76 |
3.0 |
| APL11-17 |
Male |
10 |
171 |
227 |
6.0 |
7.4 |
0.01842 |
0.02274 |
36.4 |
22.4 |
41.2 |
0.75 |
1.5 |
| APL11-18 |
Female |
10 |
234 |
245 |
22.3 |
27.6 |
0.04619 |
0.05703 |
17.1 |
20.7 |
62.2 |
0.96 |
3.0 |
| APL11-19 |
Male |
10 |
240 |
243 |
37.7 |
46.5 |
0.11008 |
0.13590 |
26.5 |
22.5 |
50.9 |
0.99 |
3.5 |
| APL11-20 |
Female |
10 |
314 |
270 |
33.0 |
40.7 |
0.06646 |
0.08205 |
15.1 |
25.9 |
59.0 |
1.16 |
3.0 |
| APL11-21 |
Female |
10 |
198 |
230 |
19.7 |
24.3 |
0.02787 |
0.03441 |
4.4 |
20.2 |
75.4 |
0.86 |
2.0 |
| APL11-23 |
Female |
30 |
322 |
278 |
33.7 |
41.6 |
0.10990 |
0.13568 |
29.2 |
20.6 |
50.2 |
1.16 |
3.5 |
| APL11-25 |
Female |
30 |
202 |
228 |
12.3 |
15.2 |
0.03167 |
0.03909 |
25.4 |
25.6 |
49.0 |
0.89 |
2.5 |
| APL11-26 |
Male |
30 |
231 |
242 |
13.0 |
16.0 |
0.01944 |
0.02400 |
8.0 |
22.1 |
69.9 |
0.95 |
2.0 |
| APL11-27 |
Female |
30 |
203 |
234 |
35.0 |
43.2 |
0.08755 |
0.10808 |
17.2 |
16.2 |
66.6 |
0.87 |
3.5 |
| APL11-28 |
Male |
30 |
188 |
226 |
21.3 |
26.3 |
0.06523 |
0.08053 |
26.7 |
23.1 |
50.2 |
0.83 |
3.0 |
| APL11-29 |
Male |
30 |
155 |
215 |
9.7 |
11.9 |
0.01682 |
0.02077 |
2.4 |
32.3 |
65.3 |
0.72 |
1.5 |
| APL11-30 |
Female |
30 |
277 |
252 |
10.0 |
12.3 |
0.02158 |
0.02664 |
13.4 |
36.6 |
50.0 |
1.10 |
2.0 |
| APL11-31 |
Female |
30 |
392 |
286 |
36.0 |
44.4 |
0.08403 |
0.10374 |
19.8 |
18.3 |
61.9 |
1.37 |
3.5 |
| APL11-32 |
Male |
30 |
200 |
234 |
28.7 |
35.4 |
0.05500 |
0.06790 |
14.0 |
27.6 |
58.4 |
0.85 |
3.0 |
| APL11-33 |
Female |
30 |
240 |
247 |
11.7 |
14.4 |
0.02287 |
0.02823 |
15.7 |
12.3 |
72.1 |
0.97 |
2.0 |
| APL11-34 |
Female |
30 |
351 |
274 |
35.0 |
43.2 |
0.07430 |
0.09173 |
17.3 |
17.3 |
65.3 |
1.28 |
3.0 |
| APL11-35 |
Female |
30 |
188 |
224 |
21.3 |
26.3 |
0.02939 |
0.03629 |
5.1 |
21.9 |
73.0 |
0.84 |
2.0 |
| APL11-36 |
Male |
30 |
283 |
262 |
27.3 |
33.7 |
0.06234 |
0.07697 |
18.7 |
21.9 |
59.4 |
1.08 |
3.0 |
|
|
|
|
|
|
|
|
|
|
|
|
|
|
|
|
|
|
|
|
|
|
|
|
|
|
|
|
|
|
MEAN |
243.7 |
244.6 |
22.9 |
28.3 |
0.05084 |
0.06276 |
15.6 |
23.3 |
61.1 |
1.0 |
2.6 |
|
|
1 SD |
91.4 |
27.0 |
13.86 |
17.1 |
0.03514 |
0.04338 |
9.4 |
6.3 |
10.6 |
0.23 |
0.7 |
|
|
MIN |
155.0 |
215.0 |
6.0 |
7.4 |
0.01559 |
0.01924 |
2.4 |
12.3 |
40.8 |
0.7 |
1.5 |
|
|
MAX |
549.0 |
328.0 |
66.0 |
81.5 |
0.13681 |
0.16891 |
36.4 |
36.6 |
75.6 |
1.7 |
4.0 |
| |
 |
|
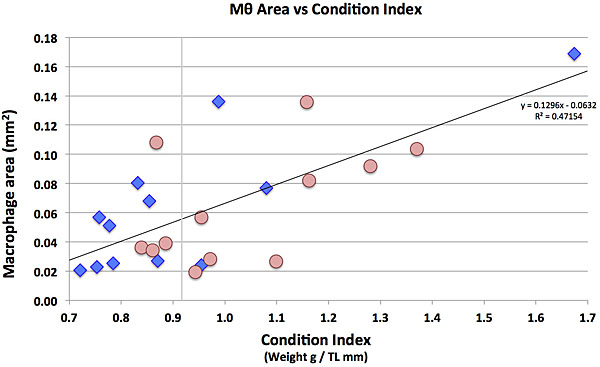
Figure xxx. Changes in splenic macrophage aggregate area (MMA) with fish condition index. Blue diamonds represent males; pink circles represent females. The general trend shows that MAA increases with increasing condition index, regardless of gender. The light gray vertical line is placed at the median condition index, 0.92. Note that two-thirds (8/12) of the animals above the median condition index are females, while two-thirds (8/12) of the animals below the median condition index are males.
|
| |
|
|
| |
|
|
| |
|
|
| |
|
|
| |
|
|
| |
|
|
| |
|
|
| |
|
|
| |
|
|
| |
|
|
|

